Charting libraries

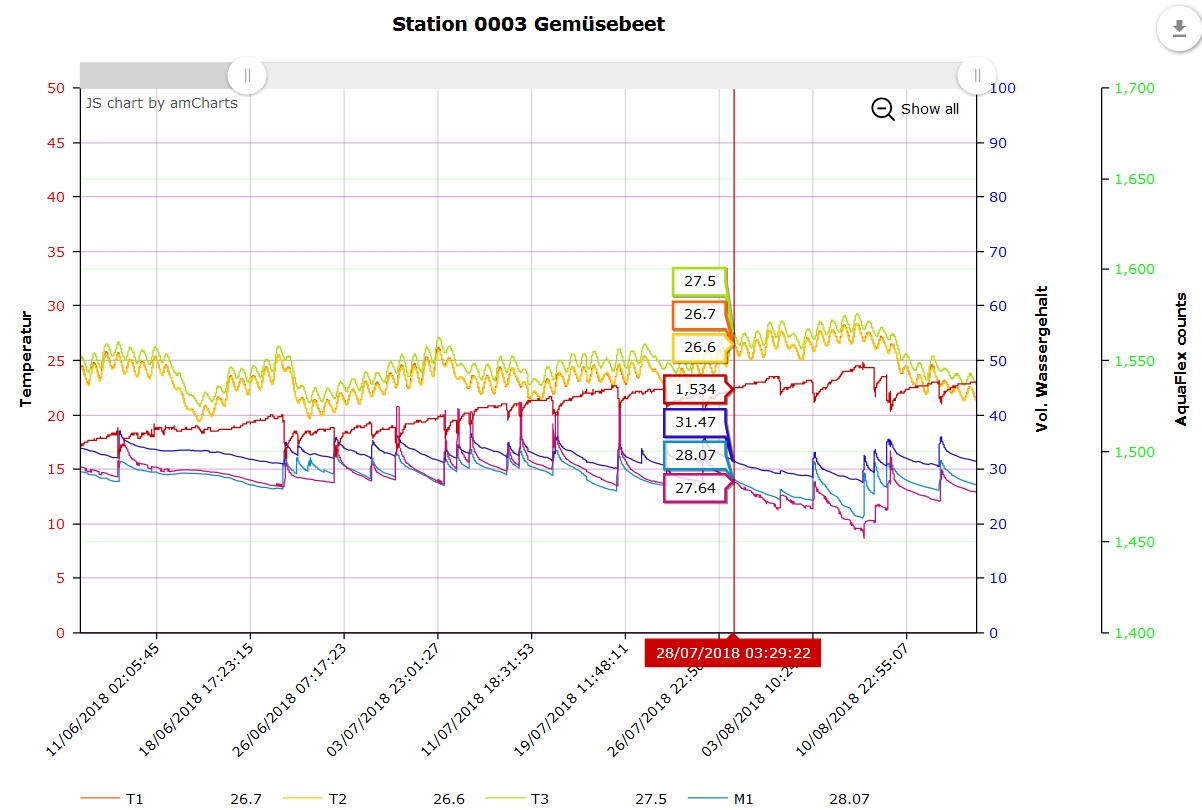
"Grandma: What is the best charting lib for webbased progammering?"  asked my grandson a few days ago and of course, granny can always give a good advice. I tried a bunch of charting libs over the past decade and happily share my experience. The blockbuster d3.js does everything you want, but the learning curve is quite steep. highcharts is definitely a good choice but my favourite charting lib is amcharts. Why? There is a simple reason. In environmental data visualization you usually have time series of data with different physical quantities like temperature, moisture, humidity and so on. So you do need multiple value axes which is quite easy to implement in amcharts. The only thing still missing and hopefully to come is dynamic loading of big data.

Soil moisture sensor comparison

How to control irrigation? This is what I have been asked so many times. For me the answer is pretty simple. I do not trust weather forecast based irrigation control since rain amount can be extremely different from one to the other location especially in summer times with thunderstorms and other localized rain events. Therefore I recommend a couple of soil moisture sensors placed on site. But what kind and brand of soil moisture sensor to choose? There are so many sensors out there that is hard to decide which is the best one for your application. For price sensitive applications I now go with the TRUEBNER SMT50 after mixed experience with the Vegetronix VH400. I recently found a comparison between the SMT50 and the VH400 which shed light on the detailed technical differences between these sensors, see here.

Voltage divider in sensor applications

The voltage divider is extensively covered in many references like Wikipedia. In the example above the battery voltage of 12 V is applied to the series connection of two equal resistors. Therefore both voltages U1 and U2 are equal and half of the battery voltage. This basic concept often causes confusion when applied to sensors with voltage output. E.g. in my irrigation system I am using the professional but low cost soil moisture and temperature sensor SMT50. It has voltage outputs both for soil moisture and temperature. According to the datasheet the output resistance is 10 kOhms. So the sensor is equal to a voltage source with 10 kOhms resistance in series. If you connect the sensor to a multimeter which has a very high input impedance in the order of many Mega- or Gigaohms then the voltage drop at the 10 kOhms resistor is negligible. You will measure the voltage of the sensor which is in the range of 0 to 3 V depending on soil moisture and temperature (see characteristic curves in the datasheet). The situation may completely change if you connect the sensor to an irrigation controller with lower impedance. E.g. some of my farm buddies use the Loxone home automation controller. According to the Loxone documentation the analog input resistance is 10 kOhms. This means that the sensor voltage is divided by a factor of two. 3 V sensor output will be recognized as 1.5 V with the Loxone controller. This is no problem at all since you can simply multiply in Loxone software by a factor of two.