Charting libraries

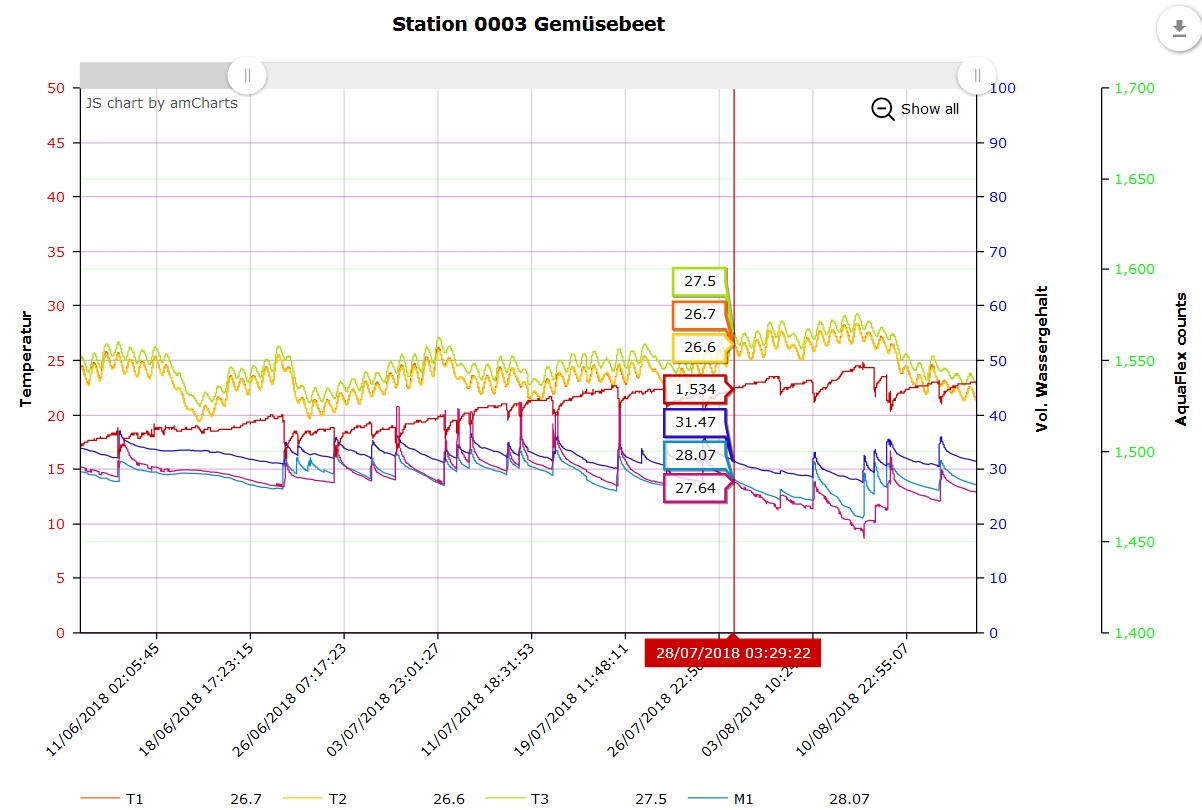
"Grandma: What is the best charting lib for webbased progammering?" asked my grandson a few days ago and of course, granny can always give a good advice. I tried a bunch of charting libs over the past decade and happily share my experience. The blockbuster d3.js does everything you want, but the learning curve is quite steep. highcharts is definitely a good choice but my favourite charting lib is amcharts. Why? There is a simple reason. In environmental data visualization you usually have time series of data with different physical quantities like temperature, moisture, humidity and so on. So you do need multiple value axes which is quite easy to implement in amcharts. The only thing still missing and hopefully to come is dynamic loading of big data.